Sustainability Appraisal - Supplementary Report: Non-Technical Summary [EXAM 115A]
Sustainability Appraisal of the Central Bedfordshire Local Plan: Supplementary Report - Non-Technical Summary
LUC was commissioned by Central Bedfordshire Council in November 2019 to undertake further work on the Sustainability Appraisal (SA) (incorporating Strategic Environmental Assessment (SEA)) of the new Central Bedfordshire Local Plan.
The Local Plan was submitted to government by Central Bedfordshire Council on 30th April 2018 and Examination hearing sessions took place between May and July 2019. Following the hearings, the Inspectors wrote to the Council raising a number of points about the SA work. The purpose of the Supplementary SA report, which this Non-Technical Summary relates to, is to present the further work that has now been undertaken to address those points. Detailed information about the scope of the Supplementary SA work undertaken, and how it relates to the comments made by the Inspectors, can be found in Chapter 2 of the full Supplementary SA Report.
In summary, the Inspectors commented on the following:
- Lack of robust justification for the strategy set out in Policy S1 (Growth Strategy) of the Local Plan
- Comments about how the SA has considered alternative strategies for employment growth
- Lack of consistency between the SA and other evidence sources
The Supplementary SA work presented in the full Supplementary SA Report and this Non-Technical Summary seeks to address these points, revisiting and reappraising where necessary the reasonable alternative options for the spatial strategy and strategic site options.
The SA work that has been carried out previously for the Local Plan was undertaken by independent consultants, Enfusion Ltd. Information about the methodology used throughout the SA process, including for this Supplementary stage of work, can be found in Chapter 3 of the full Supplementary SA Report.
Table 1 below presents the 'SA framework' which provides the basis by which the sustainability effects of the Central Bedfordshire Local Plan are described, evaluated and options compared. It includes 14 headline SA objectives that are relevant to the objectives of the Local Plan and sustainable development in Central Bedfordshire. The decision-making criteria associated with each headline objective, and the site-specific significance criteria used to appraise numerous alternative site options on a consistent basis, can be found in Chapter 3 of the full Supplementary SA Report. Both the SA objectives and the decision-making criteria remain the same as in the earlier SA work in order to maintain consistency in approach, although some of the judgements of effects have changed to better reflect the evidence base.
Table 1: SA Framework
|
SA Objectives |
|
|
|
|
|
|
|
|
|
|
|
|
|
|
Table 2 below presents the significance key showing the symbols used to illustrate the significance of effects.
Table 2: SA significance key
|
Categories of Significance of Effects |
||
|
Symbol |
Meaning |
Sustainability Effect |
|
++ |
Significant positive |
Proposed development encouraged as would resolve existing sustainability problem |
|
+ |
Minor positive |
No sustainability constraints and proposed development acceptable |
|
0 |
Neutral |
Neutral effect |
|
? |
Uncertain |
Uncertain or unknown effects |
|
- |
Minor negative |
Potential sustainability issues: mitigation and/or negotiation possible |
|
-- |
Significant negative |
Problematical and improbable because of known sustainability issues; mitigation likely to be difficult and/or expensive |
|
SA Objectives 2, 4, 5, 9 & 11 consider more than one sub-topic such that more than more than one significant effect may be predicted with two symbols: No 2 Communities – first symbol refers to in/out of Green Belt; second symbol refers to community & settlement identities. No 4 Employment – first symbol refers to employment support; second symbol refers to vitality/viability of town centres. No 5 Health & Equality – first symbol refers to regeneration/deprivation & equality; second symbol refers to green infrastructure for health & well-being. No 9 Water – first symbol refers to water resources; second symbol relates to water quality. No 11 Soil & Land – first symbol refers to greenfield & agricultural land qualities; second symbol relates previously developed land. |
||
Supplementary SA findings: Stage 1
The first stage of the Supplementary SA involved revising the SA work carried out previously in relation to various sets of reasonable alternative strategic options for the Local Plan, in order to address the Inspectors' concerns about the development of the spatial strategy.
The sections below describe the Supplementary SA work that has been undertaken in relation to these aspects of the Local Plan and summarise the SA findings.
Approaches to Distributing Development Growth
Seven options for approaches to distributing development growth were originally identified. These options were developed during late 2016 and were subject to SA with the findings being first presented in the June 2017 SA Report. The findings were again presented in the January 2018 SA Report.
A number of changes have now been made to the suite of options, so that they represent high level alternative options for the spatial distribution of development. These are detailed in full in Chapter 2 of the full Supplementary SA Report. The six options are now:
- Option 1: New settlement (village scale) – 1,500-5,000 new homes
- Option 2: New settlement (town scale) – more than 5,000 new homes
- Option 3: Village extensions – especially those with services and facilities
- Option 4: Growth around strategic roads
- Option 5: Growth around sustainable transport hubs
- Option 6: Urban extensions assumed to be 1,500-4,000 new homes
Table 3 below presents the SA findings for these options.
Table 3: Summary of likely sustainability effects of options for distribution of development growth
|
SA objective |
Option 1: New settlement (village scale) – 1,500-5,000 new homes |
Option 2: New settlement (town scale) – more than 5,000 new homes |
Option 3: Village extensions – especially those with services and facilities |
Option 4: Growth around strategic roads |
Option 5: Growth around sustainable transport hubs |
Option 6: Urban extensions assumed to be 1,500-4,000 |
|
++? |
++? |
+? |
++? |
++? |
++? |
|
+/- |
+ |
+/-? |
? |
? |
+? |
|
++? |
++? |
+? |
+/-? |
+? |
++? |
|
+/-? |
++/-? |
-? |
+? |
++? |
++? |
|
+? |
++? |
+? |
+? |
++? |
+? |
|
-? |
+? |
--? |
-? |
++? |
+? |
|
+? |
++? |
-? |
--? |
++? |
+? |
|
+? |
+? |
-? |
--? |
+? |
+? |
|
+? |
+? |
? |
? |
? |
+? |
|
? |
? |
? |
? |
? |
? |
|
+/- |
+/- |
- |
- |
- |
+/- |
|
? |
? |
? |
? |
? |
? |
|
- |
- |
--? |
- |
- |
--? |
|
? |
? |
? |
? |
? |
? |
Many of the effects identified in relation to the six options are uncertain because they will depend on the specific location of development. However, overall Options 2 (larger new settlements) and 5 (growth around sustainable transport hubs) are expected to have the highest number of significant positive effects against the SA objectives.
The larger scale of development that would result from Option 2 means that there should be particularly good opportunities for the provision of services and facilities, employment opportunities, green infrastructure and sustainable transport infrastructure as part of the new development. Where specific thresholds for the provision of facilities such as schools exist, they are most likely to be met under this option. However, it is noted that lead in times may be long for a larger new settlement meaning that some of the positive effects would be seen over the medium-long term.
New developments should be more self-contained and more easily able to establish their own character. Option 1 (smaller new settlements) does not perform as well as Option 2 because smaller new settlements would not provide as good opportunities for creating a relatively self-contained settlement with a wide range of services, facilities and employment opportunities.
Option 5 (growth around sustainable transport hubs) performs particularly well in relation to the air quality, climate change and sustainable transport SA objectives because of the ability to reduce levels of car use, and the accessibility to services, facilities and jobs for people without access to a car also contributes to the good performance of that option. In comparison,
Option 4 (growth around strategic roads) performs relatively poorly in the SA as it would be likely to facilitate high levels of car use amongst residents, with the associated impacts on air quality and greenhouse gas emissions.
Smaller developments that would occur under Option 3 (village extensions) would be likely to have much less in the way of on-site service provision compared to other options and levels of car use may be higher as residents need to travel to access jobs, services and facilities elsewhere. That option performs least well against the SA objectives.
Option 6 (urban extensions) performs better than Option 3 (village extensions) in the SA as development on the edge of larger urban areas would provide residents with easier access, particularly via sustainable modes of transport, to services, facilities and employment opportunities.
Overall, the best performing options are Option 2 (larger new settlements), Option 5 (growth around sustainable transport hubs), and Option 6 (urban extensions), and the poorest performing are Option 3 (village extensions) and Option 4 (growth around strategic roads). Option 1 (smaller new settlements) falls in the middle of these two groups of options in terms of the likely sustainability effects.
Growth scenario options: Housing
The Pre-Submission Local Plan (January 2018) includes a housing target for Central Bedfordshire of 39,350 new homes between 2015 and 2035. This is comprised of 32,000 homes to meet Central Bedfordshire's Objectively Assessed Need over that period, plus 7,350 homes to meet the unmet need arising from Luton. Because the Local Plan housing target is based on the Objectively Assessed Need, it is not considered by the Council that there are reasonable alternative options for the amount of housing to be delivered through the Local Plan, which should be subject to SA. This is also not something that has been raised as a concern by the Inspectors.
A lower housing target would not meet the Objectively Assessed Need and, given that there is sufficient land available in Central Bedfordshire to provide the identified housing requirement, this is therefore not a reasonable approach.
There is no requirement to deliver new homes over and above the Objectively Assessed Need figure. The Local Plan already seeks to go beyond Central Bedfordshire Council's Objectively Assessed Need, to deliver homes to meet the unmet needs of Luton Borough. Bearing in mind the Council has also committed to an early partial review, meaning that the housing target will be reviewed again in the near future, the Council believes it is appropriate to plan to meet the identified Objectively Assessed Need at this stage and then to determine a longer-term housing target within the early partial review. As such, no higher than Objectively Assessed Need option has been tested.
Alternative options for the quantum of housing development to be delivered through the Local Plan are therefore not considered in the Supplementary SA.
In terms of the quantum of employment land to be provided to meet the Objectively Assessed (local) Need, the evidence[2] shows that a minimum of 24,000 jobs will be required over the Local Plan period. It is not considered by the Council to be a reasonable option to allocate land for fewer than 24,000 new jobs because there are sufficient available sites within Central Bedfordshire and so there is no justification for planning not to meet the identified need for jobs. The option of providing additional employment land is considered in relation to the provision of sites for footloose strategic warehousing only, as described below.
As alluded to in the Inspectors' post-hearing letter, there are alternative overall strategies for employment growth which could include whether or not to cater for 'footloose' demand in the logistics and distribution sector. Therefore, Supplementary SA work has been carried out in relation to the following options:
- Option 1: Provide land to meet some of the footloose regional demand for strategic warehousing, in addition to the land allocated to meet local employment need.
- Option 2: Do not provide land to meet some of the footloose regional demand for strategic warehousing.
Option 2 would have negligible effects on all but one of the SA objectives, with the exception being a minor negative effect against SA objective 4: employment due to the lost opportunity to contribute towards regional and local economic development and associated jobs.
The effects of Option 1 are generally positive in relation to the social and economic SA objectives, as warehousing sites would provide employment opportunities and potentially help to address inequalities.
However, the effects of Option 1 on the environmental SA objectives are generally negative. Because strategic warehousing developments are usually large in scale, they can be prominent features in the landscape and any adverse effects on the landscape and cultural heritage, in particular, may be difficult to mitigate.
The nature of these developments also means that they are likely to be located close to the main roads, with many employees likely to travel to work via car with the associated impacts on air quality and greenhouse gas emissions. However, the negative effects are uncertain until the location and design of sites are known, and mitigation proposals are detailed. As the effects at this strategic level of assessment are so uncertain, it is difficult to conclude whether the social and economic benefits of warehouse sites could outweigh the potential negative effects.
Thirty eight options for strategic housing site allocations were identified at the Regulation 18 stage, with nine of these being considered reasonable alternative options for the purposes of SA. A review was undertaken to determine whether the strategic sites appraised previously still remain the reasonable alternative options – see Appendix C in the full Supplementary SA Report. For the purposes of the Supplementary SA, a number of changes have been made to the list of reasonable alternatives, including the addition of some further reasonable alternative options based on the Inspectors' comments about there being potential discrepancies between the capacities considered for certain sites. The changes made to the suite of reasonable alternative strategic housing site options are detailed in Appendix C, and this resulted in the identification of 19 reasonable alternative options.
The SA findings for the 19 reasonable alternative residential site options are described further ahead in this Non-Technical Summary.
The original SA Report included an appraisal of three alternative strategic employment sites to contribute to the regional footloose demand that had been identified:
- Sundon Rail Freight Interchange
- Biggleswade, West of A1
- Ridgmont, M1 Junction 13
A further 13 reasonable alternative employment site options have now been appraised in the Supplementary SA. These sites are considered to be reasonable alternative options for the purposes of SA, although they were previously omitted from the SA process. The SA findings for the 16 reasonable alternative employment site options are described further ahead in this Non-Technical Summary.
Supplementary SA findings: Stage 2
Once the Supplementary SA work described above had been carried out, it was necessary to undertake a second stage of work. This involved drawing together the findings from the various strands of the SA (i.e. the different sets of strategic options) and considering the headline questions and decisions that the Council needs to address in preparing the Local Plan, in the light of the updated SA findings. This second stage of work is presented in Chapter 5 of the full Supplementary SA Report and summarised in the following sections.
SA work undertaken previously on Areas A-D
As described in Chapter 2 in the full Supplementary SA Report, four areas (A-D) were identified by Central Bedfordshire Council early on in the plan-making process, recognising the different characteristics of Central Bedfordshire:
- Area A: South & West/M1 Corridor
- Area B: East/A1 Corridor
- Area C: East/West Corridor
- Area D: Central Section
The locations of these areas are mapped in Figure 1 at the end of this Non-Technical Summary.
These areas were not intended as four alternatives, but rather as distinct areas to help guide plan-making. The four areas were subject to SA previously. No changes have since been made to the options and no further SA work has been required. The SA findings reported previously are presented in detail in Chapter 5 of the full Supplementary SA Report and are summarised in Table 4 below.
Table 4: SA findings for Areas A-D
|
SA objective |
Areas for potential development growth |
|||||||
|
A (South & West/M1 corridor) |
B (East/A1 corridor) |
C (East/West corridor) |
D (Central section) |
|||||
|
++? |
++? |
++? |
+? |
||||
|
--? |
? |
+ |
? |
+ |
? |
+ |
? |
|
+? |
+? |
+? |
+? |
||||
|
+? |
++? |
++? |
+? |
||||
|
++? |
+? |
++? |
0? |
||||
|
0? |
-? |
-? |
-? |
||||
|
+? |
++? |
++? |
0? |
||||
|
0? |
0? |
0? |
0? |
||||
|
0? |
0? |
0? |
0? |
||||
|
0? |
0? |
0? |
0? |
||||
|
- |
- |
- |
- |
||||
|
0? |
0? |
0? |
0? |
||||
|
- |
- |
- |
- |
||||
|
0? |
0? |
0? |
0? |
||||
At this strategic level of assessment, there was considerable uncertainty in the SA findings since the likely effects depend upon the scale, nature and location of proposed development within each Area, as well as the possibilities for implementing mitigation measures. Area C performed the best of the four Areas in the SA, with four potential significant positive effects identified. The next best performing was Area B, with three potential significant positive effects, followed by Areas A and D with two and zero likely significant positive effects identified respectively.
Area D performed poorest of all the Areas in the SA, as the area offers the potential only for smaller-scale development which would not deliver, or provide access to, as wide a range of services, facilities and infrastructure. Conversely, development in Area C could be larger-scale, and would have good potential in terms of employment and the economy due to the focus in that area of research and development activities. The area is also well-connected in transport terms. The Green Belt in Area A is a significant constraint and that was the only Area which had a potential significant negative effect associated with it.
Chapter 5 in the full Supplementary SA Report considers the SA findings for the residential site options in the context of both which of Areas A-D they are located in, and how they relate to the alternative approaches to distributing development (summarised earlier in this document).
Table 5 below lists the residential site options in each of Areas A-D and shows which of the distribution options they are classified as, as well as how many homes they could accommodate. The sites that are currently allocated in the submitted version of the Local Plan are shaded in grey.
Table 5: Alternative site options matrix
|
Area |
Site options |
Distribution type(s) |
Number of homes |
|
A |
Luton North Option 1 |
4, 6 |
Up to 4,000 |
|
Luton North Option 2 |
4, 6 |
Up to 3,100 |
|
|
Luton North Option 3 |
4, 6 |
Up to 3,600 |
|
|
Luton West Option 1 |
1, 4, 6 |
Up to 2,000 |
|
|
Luton West Option 2 |
1, 4, 6 |
Up to 3,500 |
|
|
Luton West Option 3 |
1, 4, 6 |
Upwards of 4,600 |
|
|
Houghton Regis North |
4, 6 |
Between 4,150 and 5,150 |
|
|
B |
Arlesey Option 1 |
4, 5, 6 |
Up to 2,000 |
|
Arlesey Option 2 |
4, 5, 6 |
Up to 2,000 |
|
|
Arlesey Option 3 |
4, 5, 6 |
Up to 1,800 |
|
|
Biggleswade East Phase 1 |
1 |
Up to 1,500 |
|
|
Biggleswade East Phase 2 |
2 |
Up to 5,500 |
|
|
North and North East Sandy |
4, 5, 6 |
4,750 |
|
|
Tempsford South and Tempsford Airfield |
2 |
Up to 10,000 |
|
|
C |
Aspley Guise |
4, 6 |
Up to 3,000 |
|
Marston Moretaine North (Marston Thrift) |
1, 4 |
Up to 1,500 |
|
|
Marston Moretaine South (Marston Vale) |
1, 4, 5 |
Up to 5,000 |
|
|
Wixams South |
3 |
Up to 650 |
|
|
D |
Henlow Airfield and Camp |
1, 3[3] |
1,000 |
Table 6: Key to distribution types
|
Number |
Type of distribution |
|
1 |
New settlement (village scale) – 1,500-5,000 new homes |
|
2 |
New settlement (town scale) – more than 5,000 new homes |
|
3 |
Village extensions – especially those with services and facilities |
|
4 |
Growth around strategic roads |
|
5 |
Growth around sustainable transport hubs |
|
6 |
Urban extensions assumed to be 1,500-4,000 |
Tables 7-10 below summarises the SA findings for the strategic residential site options that have been considered in each of Areas A-D, and the text after the tables summarises the likely effects of the sites. More detailed comparison of the site options by Area can be found in Chapter 5 of the full Supplementary SA Report.
The locations of these sites are shown in Figure 2 at the end of this Non-Technical Summary.
Table 7: SA findings for strategic site options in Area A
|
SA objectives |
Site options |
|||||||
|
Luton North Option 1 |
Luton North Option 2 |
Luton North Option 3 |
Luton West Option 1 |
Luton West Option 2 |
Luton West Option 3 |
Houghton Regis North |
||
|
++ |
++ |
++ |
++ |
++ |
++ |
++ |
|
|
Green Belt |
-- |
-- |
-- |
-- |
-- |
-- |
-- |
|
Settlement identities |
- |
- |
- |
- |
- |
- |
-? |
|
|
++ |
++ |
++ |
++? |
++? |
++? |
++ |
|
|
Employment support |
++ |
+ |
+ |
+ |
+ |
+ |
+ |
|
Town centres |
+ |
+ |
+ |
+? |
+? |
+? |
+ |
|
|
Regeneration |
+ |
+ |
+ |
+? |
+? |
+? |
++? |
|
Green infrastructure |
++ |
++ |
++ |
++ |
++ |
++ |
++ |
|
|
-? |
-? |
-? |
--? |
--? |
--? |
--? |
|
|
+ |
+ |
+ |
+ |
+ |
+ |
+ |
|
|
+? |
+? |
+? |
+? |
+? |
+? |
+? |
|
|
0? |
0? |
0? |
0? |
0? |
0? |
0? |
|
|
0 |
0 |
0 |
0 |
0 |
0 |
0 |
|
|
Agricultural land classification |
--? |
--? |
--? |
--? |
--? |
--? |
--? |
|
Previously developed land |
0 |
0 |
0 |
0 |
0 |
0 |
0 |
|
|
+/-? |
+/-? |
+/-? |
+/-? |
+/-? |
+/--? |
+/-? |
|
|
--? |
-? |
-? |
-? |
--? |
--? |
+? |
|
|
-? |
-? |
-? |
0? |
0? |
-? |
-? |
|
Table 8: SA findings for strategic site options in Area B
|
SA objectives |
Site options |
|||||||
|
Arlesey Option 1 |
Arlesey Option 2 |
Arlesey Option 3 |
Biggleswade East Phase 1 |
Biggleswade East Phase 2 |
Tempsford South and Tempsford Airfield |
North and North East Sandy |
||
|
++ |
++ |
++ |
++ |
++ |
++ |
++ |
|
|
Green Belt |
0 |
0 |
0 |
0? |
0? |
0 |
0 |
|
Settlement identities |
- |
- |
- |
+ |
- |
--? |
-? |
|
|
++ |
++ |
++ |
++ |
++ |
++ |
++? |
|
|
Employment support |
0 |
0 |
0 |
+? |
+ |
+ |
+? |
|
Town centres |
+ |
+ |
+ |
+ |
+ |
+ |
+ |
|
|
Regeneration |
0 |
0 |
0 |
0 |
0 |
+? |
+? |
|
Green infrastructure |
++ |
++ |
++ |
++ |
++ |
++ |
++ |
|
|
0? |
0? |
0? |
0? |
0? |
-? |
--? |
|
|
+ |
+ |
+ |
+ |
+ |
+? |
+ |
|
|
+? |
+? |
+? |
+? |
+? |
+? |
+? |
|
|
0? |
0? |
0? |
0? |
0? |
0? |
0? |
|
|
0 |
0 |
0 |
-? |
-? |
0 |
0 |
|
|
Agricultural land classification |
--? |
--? |
--? |
--? |
--? |
--? |
--? |
|
Previously developed land |
0 |
0 |
0 |
0 |
0 |
+ |
0 |
|
|
++/-? |
+/-? |
+/-? |
-? |
-? |
+/-? |
+/-? |
|
|
+/- |
+/- |
+/- |
+? |
+? |
-? |
-? |
|
|
-? |
-? |
-? |
0? |
--? |
--? |
-? |
|
Table 9: SA findings for strategic site options in Area C
|
SA objectives |
Site options |
||||
|
Aspley Guise |
Marston Moretaine North (Marston Thrift) |
Marston Moretian South (Marston Vale) |
Wixams South |
||
|
++ |
++ |
++ |
++ |
|
|
Green Belt |
0 |
0 |
0 |
0? |
|
Settlement identities |
-? |
--? |
--? |
- |
|
|
++ |
++? |
++ |
++ |
|
|
Employment support |
0 |
0 |
++ |
0 |
|
Town centres |
+ |
+? |
+ |
+ |
|
|
Regeneration |
0 |
0 |
0 |
0 |
|
Green infrastructure |
++ |
++ |
++ |
++ |
|
|
0? |
-? |
-? |
0? |
|
|
++ |
+ |
++ |
+ |
|
|
+? |
+? |
+? |
+? |
|
|
0? |
0? |
0? |
0? |
|
|
0 |
0 |
0 |
0 |
|
|
Agricultural land classification |
--? |
--? |
--? |
--? |
|
Previously developed land |
0 |
0 |
+ |
0? |
|
|
-? |
+/-? |
+/-? |
+/-? |
|
|
+? |
+? |
+? |
+? |
|
|
-? |
-? |
-? |
-? |
|
Table 10: SA findings for strategic site option in Area D
|
SA objectives |
Site option |
|
|
Henlow Airfield and Camp |
||
|
++ |
|
|
Green Belt |
0 |
|
Settlement identities |
+ |
|
|
++? |
|
|
Employment support |
+ |
|
Town centres |
+ |
|
|
Regeneration |
0 |
|
Green infrastructure |
++ |
|
|
--? |
|
|
+ |
|
|
+? |
|
|
0? |
|
|
0 |
|
|
Agricultural land classification |
--? |
|
Previously developed land |
+ |
|
|
+/-? |
|
|
+? |
|
|
--? |
|
Looking across the 19 residential site options as a whole, the likely sustainability effects are not particularly varied in terms of the number of likely significant positive and negative effects identified. The most significant positive effects associated with a single residential site option is five, which is the case for Marston Moretaine South (Marston Vale). There are only two potential significant negative effects associated with that site, so overall it performs best against the SA objectives. Looking across the SA objectives, the other sites that perform relatively well are Arlesey (in particular Option 1), Aspley Guise, Biggleswade East Phase 1, and Wixams South.
The three Luton West options perform the least well, with three significant negative effects associated with Option 1, four with Option 2 and five with Option 3. The Luton North options perform slightly better, but not as well as many of the other options. Luton North Option 1 also has three significant negative effects but these are counterbalanced by four significant positive effects. The other two Luton North options have two significant negative and three significant positive effects each. Tempsford South and Tempsford Airfield performs similarly to the Luton options, with three significant negative effects.
Henlow Airfield and Camp and Houghton Regis North also have three significant effects, but these each have three significant positive effects. As a result these two options perform in the middle of all the options, along with Marston Moretaine North (Marston Thrift) and Biggleswade East Phase 2.
With respect to the residential sites in each of the four areas (A-D), the Supplementary SA came to the following conclusions:
- In Area A (South & West/ M1 corridor), it was recognised that Houghton Regis North already has planning consent and therefore the key decisions to be made by Central Bedfordshire Council in Area A are based around the sites adjacent to Luton. The SA found that, overall, Luton North performs better than Luton West. Comparing the three alternative options at Luton North, Options 2 and 3 perform slightly better in SA terms than Option 1 as the negative effects on the landscape are not considered likely to be significant under Options 2 and 3. The SA also considered the options of not allocating development at either Luton North or Luton West, or allocating smaller scale development at both Luton North and Luton West, or relying on village extensions instead, but found that the most sustainable approach would be to allocate development at Luton North (either Option 2 or 3).
- In Area B (East/A1 corridor), Arlesey is the best performing location with Arlesey Option 1 performing marginally better than Arlesey Options 2 and 3. Biggleswade East Phase 1 also performs well, and considerably better than Biggleswade East Phase 2. Tempsford South and Tempsford Airfield is the poorest performing site in Area B. North and North East Sandy falls somewhere in the middle, similar to Biggleswade East Phase 2.
- In Area C (East/ west corridor), Marston Moretaine South (Marston Vale) performs best of all the site options, and better than Marston Moretaine North (Marston Thrift). The SA found that if both sites were to be allocated, this would concentrate a significant amount of development in that area, and could result in significant cumulative impacts on the road network, landscape and nearby settlements. Wixams South and Aspley Guise are similar in terms of their SA performance, performing relatively well against the SA objectives as a whole, better than Marston Moretaine North (Marston Thrift), but not as well as Marston Moretaine South (Marston Vale).
- In Area D (Central section), there is only one strategic residential site option, being at Henlow Airfield and Camp. The SA found that Henlow Airfield and Camp itself performs moderately well against the SA objectives, but noted that Area D is generally a less sustainable location for strategic growth.
The following sites are included as allocations in the submitted Local Plan:
- Luton North (Option 1) (Area A)
- Houghton Regis North (Area A)
- Arlesey Option 1 (Area B)
- Biggleswade East (Phase 1) (Area B)
- Marston Moretaine South (Marston Vale) (Area C)
No strategic residential site allocations are made in Area D.
Information is set out in Chapter 5 of the full Supplementary SA Report about Central Bedfordshire Council's reasons for selecting or rejecting the various strategic site options in the submitted Local Plan.
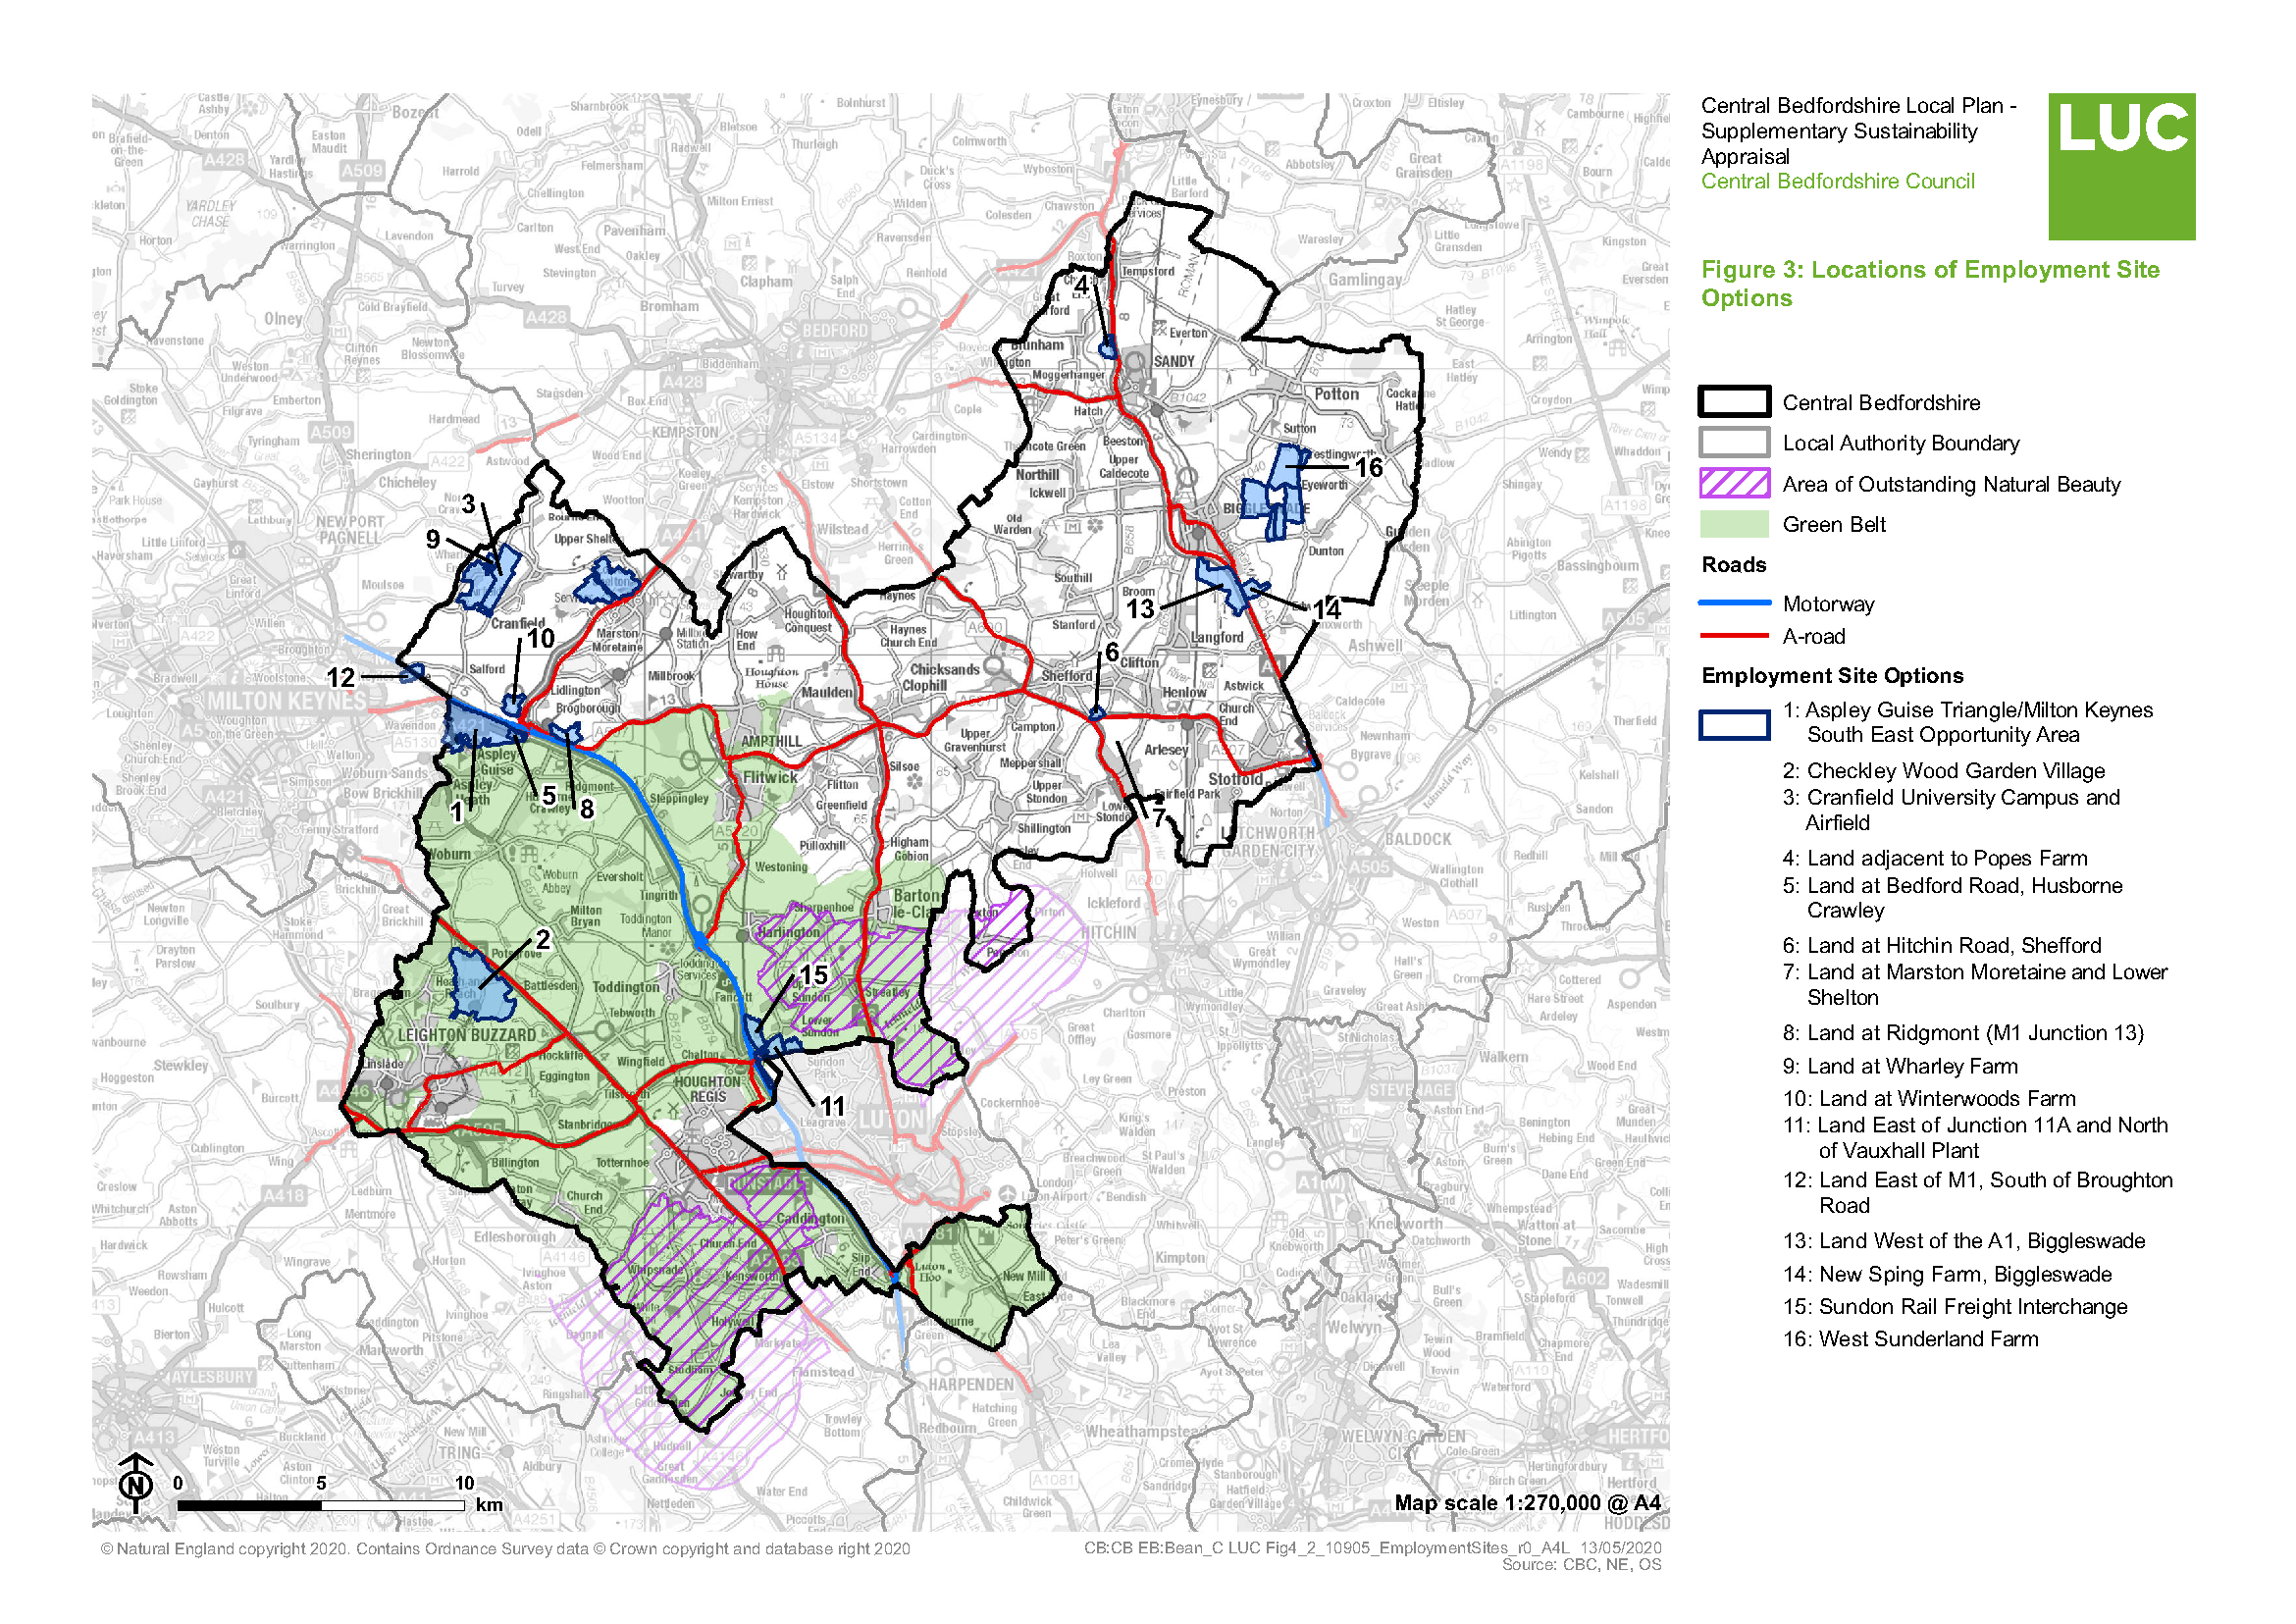
Chapter 5 in the full Supplementary SA Report considers the SA findings for the employment site options. The 16 reasonable alternative site options are listed below.
- Aspley Guise Triangle/Milton Keynes South East Opportunity Area
- Checkley Wood Garden Village
- Cranfield University Campus and Airfield
- Land adjacent to Popes Farm
- Land at Bedford Road, Husborne Crawley
- Land at Hitchin Road, Shefford
- Land at Marston Moretaine and Lower Shelton
- Land at Ridgmont (M1 Junction 13)
- Land at Wharley Farm
- Land at Winterwoods Farm
- Land East of Junction 11A and North of Vauxhall Plant
- Land East of M1, South of Broughton Road
- Land West of the A1, Biggleswade
- New Spring Farm, Biggleswade
- Sundon Rail Freight Interchange
- West Sunderland Farm
The locations of these sites are shown in Figure 3 at the end of this Non-Technical Summary.
Chapter 5 in the full Supplementary SA Report considers the SA findings for the employment site options in both the A1 and M1 corridors. The sites have been considered on the basis of the A1 and M1 corridors as it is assumed that strategic employment sites, which are being considered for their potential as warehousing sites, would be located adjacent to the strategic road network.
Tables 11 and 12 present the SA findings for the employment site options.
Table 11: SA findings for employment site options in the A1 corridor
|
SA objectives |
Site options |
|||||
|
Land West of the A1, Biggleswade |
Land adjacent to Popes Farm |
Land at Hitchin Road, Shefford |
New Spring Farm, Biggleswade |
West Sunderland Farm |
||
|
0 |
0 |
0 |
0 |
0 |
|
|
Green Belt |
0 |
0 |
0 |
0 |
0 |
|
Settlement identities |
-? |
0 |
0 |
0 |
-? |
|
|
0 |
0 |
0 |
0 |
0 |
|
|
Employment support |
++ |
++ |
++ |
++ |
++ |
|
Town centres |
++ |
++ |
? |
++ |
++ |
|
|
Regeneration |
0 |
+ |
0 |
0 |
0 |
|
Green infrastructure |
++ |
++ |
++ |
++ |
++ |
|
|
-? |
--? |
-? |
-? |
-? |
|
|
++? |
+ |
+ |
+ |
+ |
|
|
+? |
+? |
+? |
+? |
+? |
|
|
0? |
0 |
0 |
0 |
0 |
|
|
0 |
- |
0 |
0 |
0 |
|
|
Agricultural land classification |
--? |
--? |
--? |
--? |
--? |
|
Previously developed land |
0 |
0 |
0 |
0 |
0 |
|
|
+? |
+? |
+? |
+? |
+? |
|
|
+? |
0? |
--? |
0? |
--? |
|
|
0? |
-? |
0 |
0? |
--? |
|
Table 12: SA findings for employment site options in the M1 corridor
|
SA objectives |
Site options |
|||||||||||
|
Sundon RFI |
Land at Ridgmont (M1 Junction 13) |
Aspley Guise Triangle/Milton Keynes South East Opportunity Area |
Checkley Wood Garden Village |
Cranfield University Campus and Airfield |
Land at Bedford Road, Husborne Crawley |
Land at Marston Moretaine and Lower Shelton |
Land at Wharley Farm |
Land at Winterwoods Farm |
Land East of Junction 11A and North of Vauxhall Plant |
Land East of M1, South of Broughton Road |
||
|
0 |
0 |
0 |
0 |
0 |
0 |
0 |
0 |
0 |
0 |
0 |
|
|
Green Belt |
-- |
0 |
0 |
-- |
0 |
0 |
0 |
0 |
0 |
-- |
0 |
|
Settlement identities |
0 |
0 |
-? |
-? |
0 |
0 |
--? |
+ |
0 |
-? |
0? |
|
|
0 |
0 |
0 |
0 |
0 |
0 |
0 |
0 |
0 |
0 |
0 |
|
|
Employment support |
++ |
++ |
++ |
++ |
++ |
++ |
++ |
++ |
++ |
++ |
++ |
|
Town centres |
++ |
? |
+ |
? |
? |
? |
? |
? |
? |
+ |
? |
|
|
Regeneration |
+ |
0 |
0 |
0 |
0? |
0 |
0 |
0 |
0 |
0 |
0 |
|
Green infrastructure |
++ |
++ |
++ |
++ |
+ |
++ |
++ |
+ |
++ |
++ |
++ |
|
|
+/-? |
-? |
-? |
-? |
-? |
-? |
- |
-? |
-? |
--? |
-? |
|
|
++ |
++ |
+ |
- |
+ |
+ |
+ |
+ |
+ |
+ |
+ |
|
|
+? |
+? |
+? |
0? |
+? |
+? |
+? |
+? |
+? |
+? |
+ |
|
|
0 |
0? |
0 |
0 |
0? |
0 |
0? |
0? |
0? |
0 |
0? |
|
|
0 |
0 |
0 |
0 |
0 |
0 |
0 |
0 |
0 |
0 |
0 |
|
|
Agricultural land classification |
--? |
--? |
--? |
--? |
0? |
--? |
--? |
--? |
--? |
--? |
--? |
|
Previously developed land |
0 |
0? |
0 |
++? |
++? |
0 |
0 |
0 |
0? |
0 |
0 |
|
|
-? |
+? |
+? |
-? |
+? |
+? |
-? |
+? |
+? |
-? |
+? |
|
|
--? |
+? |
--? |
--? |
+? |
--? |
+? |
+? |
+? |
+? |
+? |
|
|
0 |
0? |
-? |
-? |
0? |
0 |
-? |
0? |
-? |
-? |
0? |
|
Overall, the likely sustainability effects of the 16 employment site options are not particularly varied in terms of the number of likely significant positive and negative effects identified. The most significant positive effects associated with a single employment site option is four, which is the case for two sites (Sundon Rail Freight Interchange and Land West of the A1, Biggleswade). However, Sundon Rail Freight Interchange, along with three other sites (Land East of Junction 11A and North of Vauxhall Plant; West Sunderland Farm and Checkley Wood Garden Village) also has the largest number of significant negative effects associated with any one site (three).
Looking across all the SA objectives, the employment sites that perform most strongly are Cranfield University Campus and Airfield, Land West of the A1, Biggleswade, Land at Ridgmont (M1 Junction 13), New Spring Farm, Biggleswade, and Land East of M1, South of Broughton Road. The employment sites that perform least well are Checkley Wood Garden Village, Land East of Junction 11A and North of Vauxhall Plant, Land at Marston Moretaine and Lower Shelton, West Sunderland Farm, and Aspley Guise Triangle/Milton Keynes South East Opportunity Area. The other employment sites fall between these two groups of sites.
With respect to the two main strategic transport corridors, the Supplementary SA came to the following conclusions:
- In the M1 corridor, the best performing in SA terms was Cranfield University Campus and Airfield, followed by Land at Ridgmont (M1 Junction 13). Checkley Wood Garden Village performs least well compared to the other site options. The SA noted that the effects of Sundon Rail Freight Interchange are more complex than for some of the other sites, with more of a mix of significant positive and negative effects, but recognised the positive opportunities presented in terms of sustainable transport by facilitating the bulk transfer of goods movement from road to rail.
- In the A1 corridor, the Land West of the A1, Biggleswade, performs best, with West Sunderland Farm performing the least well.
The SA also noted the potential for cumulative effects, for example on the landscape in the M1 corridor, or on the Air Quality Management Area at Sandy in the A1 corridor, if multiple strategic warehousing sites were to be allocated in the Local Plan.
The following sites are included as allocations in the submitted Local Plan:
- Sundon Rail Freight Interchange (M1 Corridor)
- Land at Ridgmont (M1 Junction 13) (M1 Corridor)
- Land West of the A1, Biggleswade (A1 corridor)
Information is set out in Chapter 5 of the full Supplementary SA Report about Central Bedfordshire Council's reasons for selecting or rejecting the various strategic employment site options in the submitted Local Plan.
Changes to the SA findings
A summary of the changes that have been made to the SA findings reported previously as a result of this supplementary stage of SA work can be found in Chapter 6 in the full Supplementary SA Report.
Monitoring
The SEA Regulations require that consideration is given to monitoring the significant effects of the plan or programme in question. Chapter 7 in the full Supplementary SA Report sets out a number of suggested indicators for monitoring the potential sustainability effects of the Local Plan. Where possible, this draws from the indicators set out in the Council's most recent Annual Monitoring Report[4].
Next Steps
Central Bedfordshire Council will submit the full Supplementary SA Report and this Non-Technical Summary to the Inspectors, alongside Technical Papers on Housing, Employment and Transport that consider its findings alongside other evidence, to demonstrate how the issues raised in their letter of 30th September 2019 have been resolved. Public consultation will be held on all new evidence and it is expected that further hearing sessions will be held.
Once Central Bedfordshire Council has proposed any modifications to the Local Plan that may result from this Supplementary SA work and the other work that is ongoing for the preparation of the Local Plan, those proposed changes will need to be subject to SA. At that point, consideration will also need to be given to the cumulative effects of the Local Plan as a whole, as it is proposed to be amended.
Figure 1
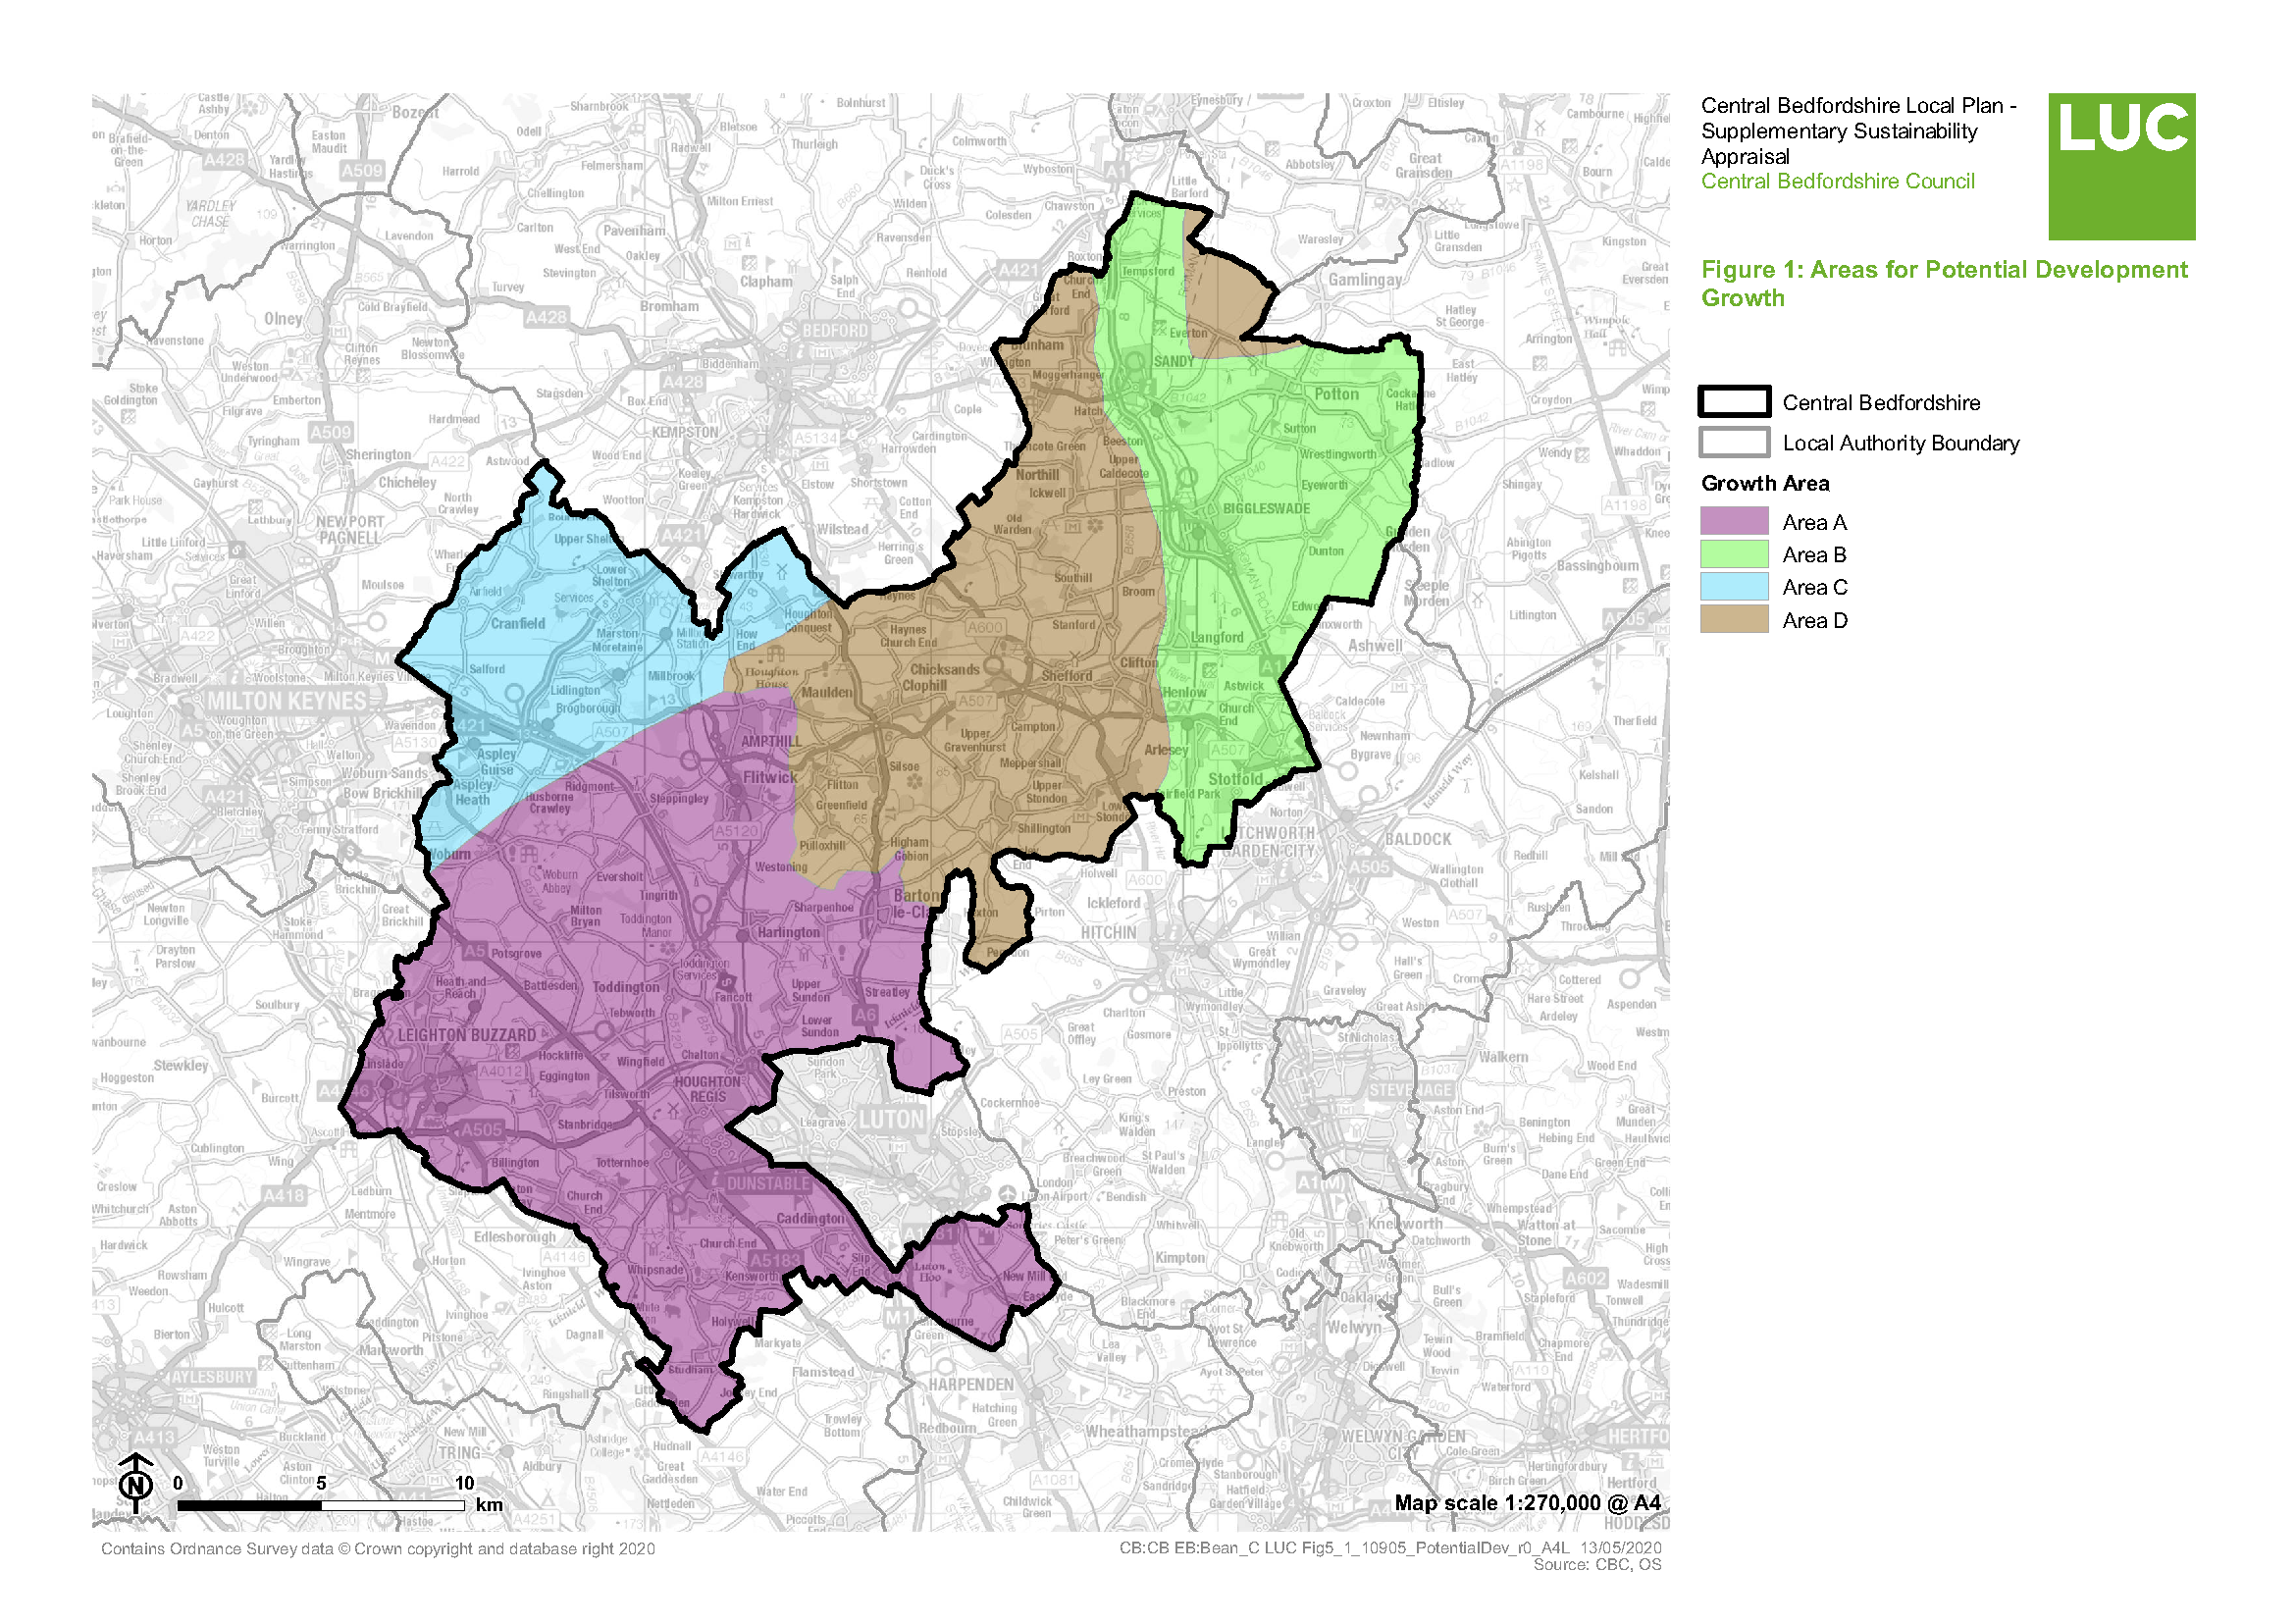
Figure 2
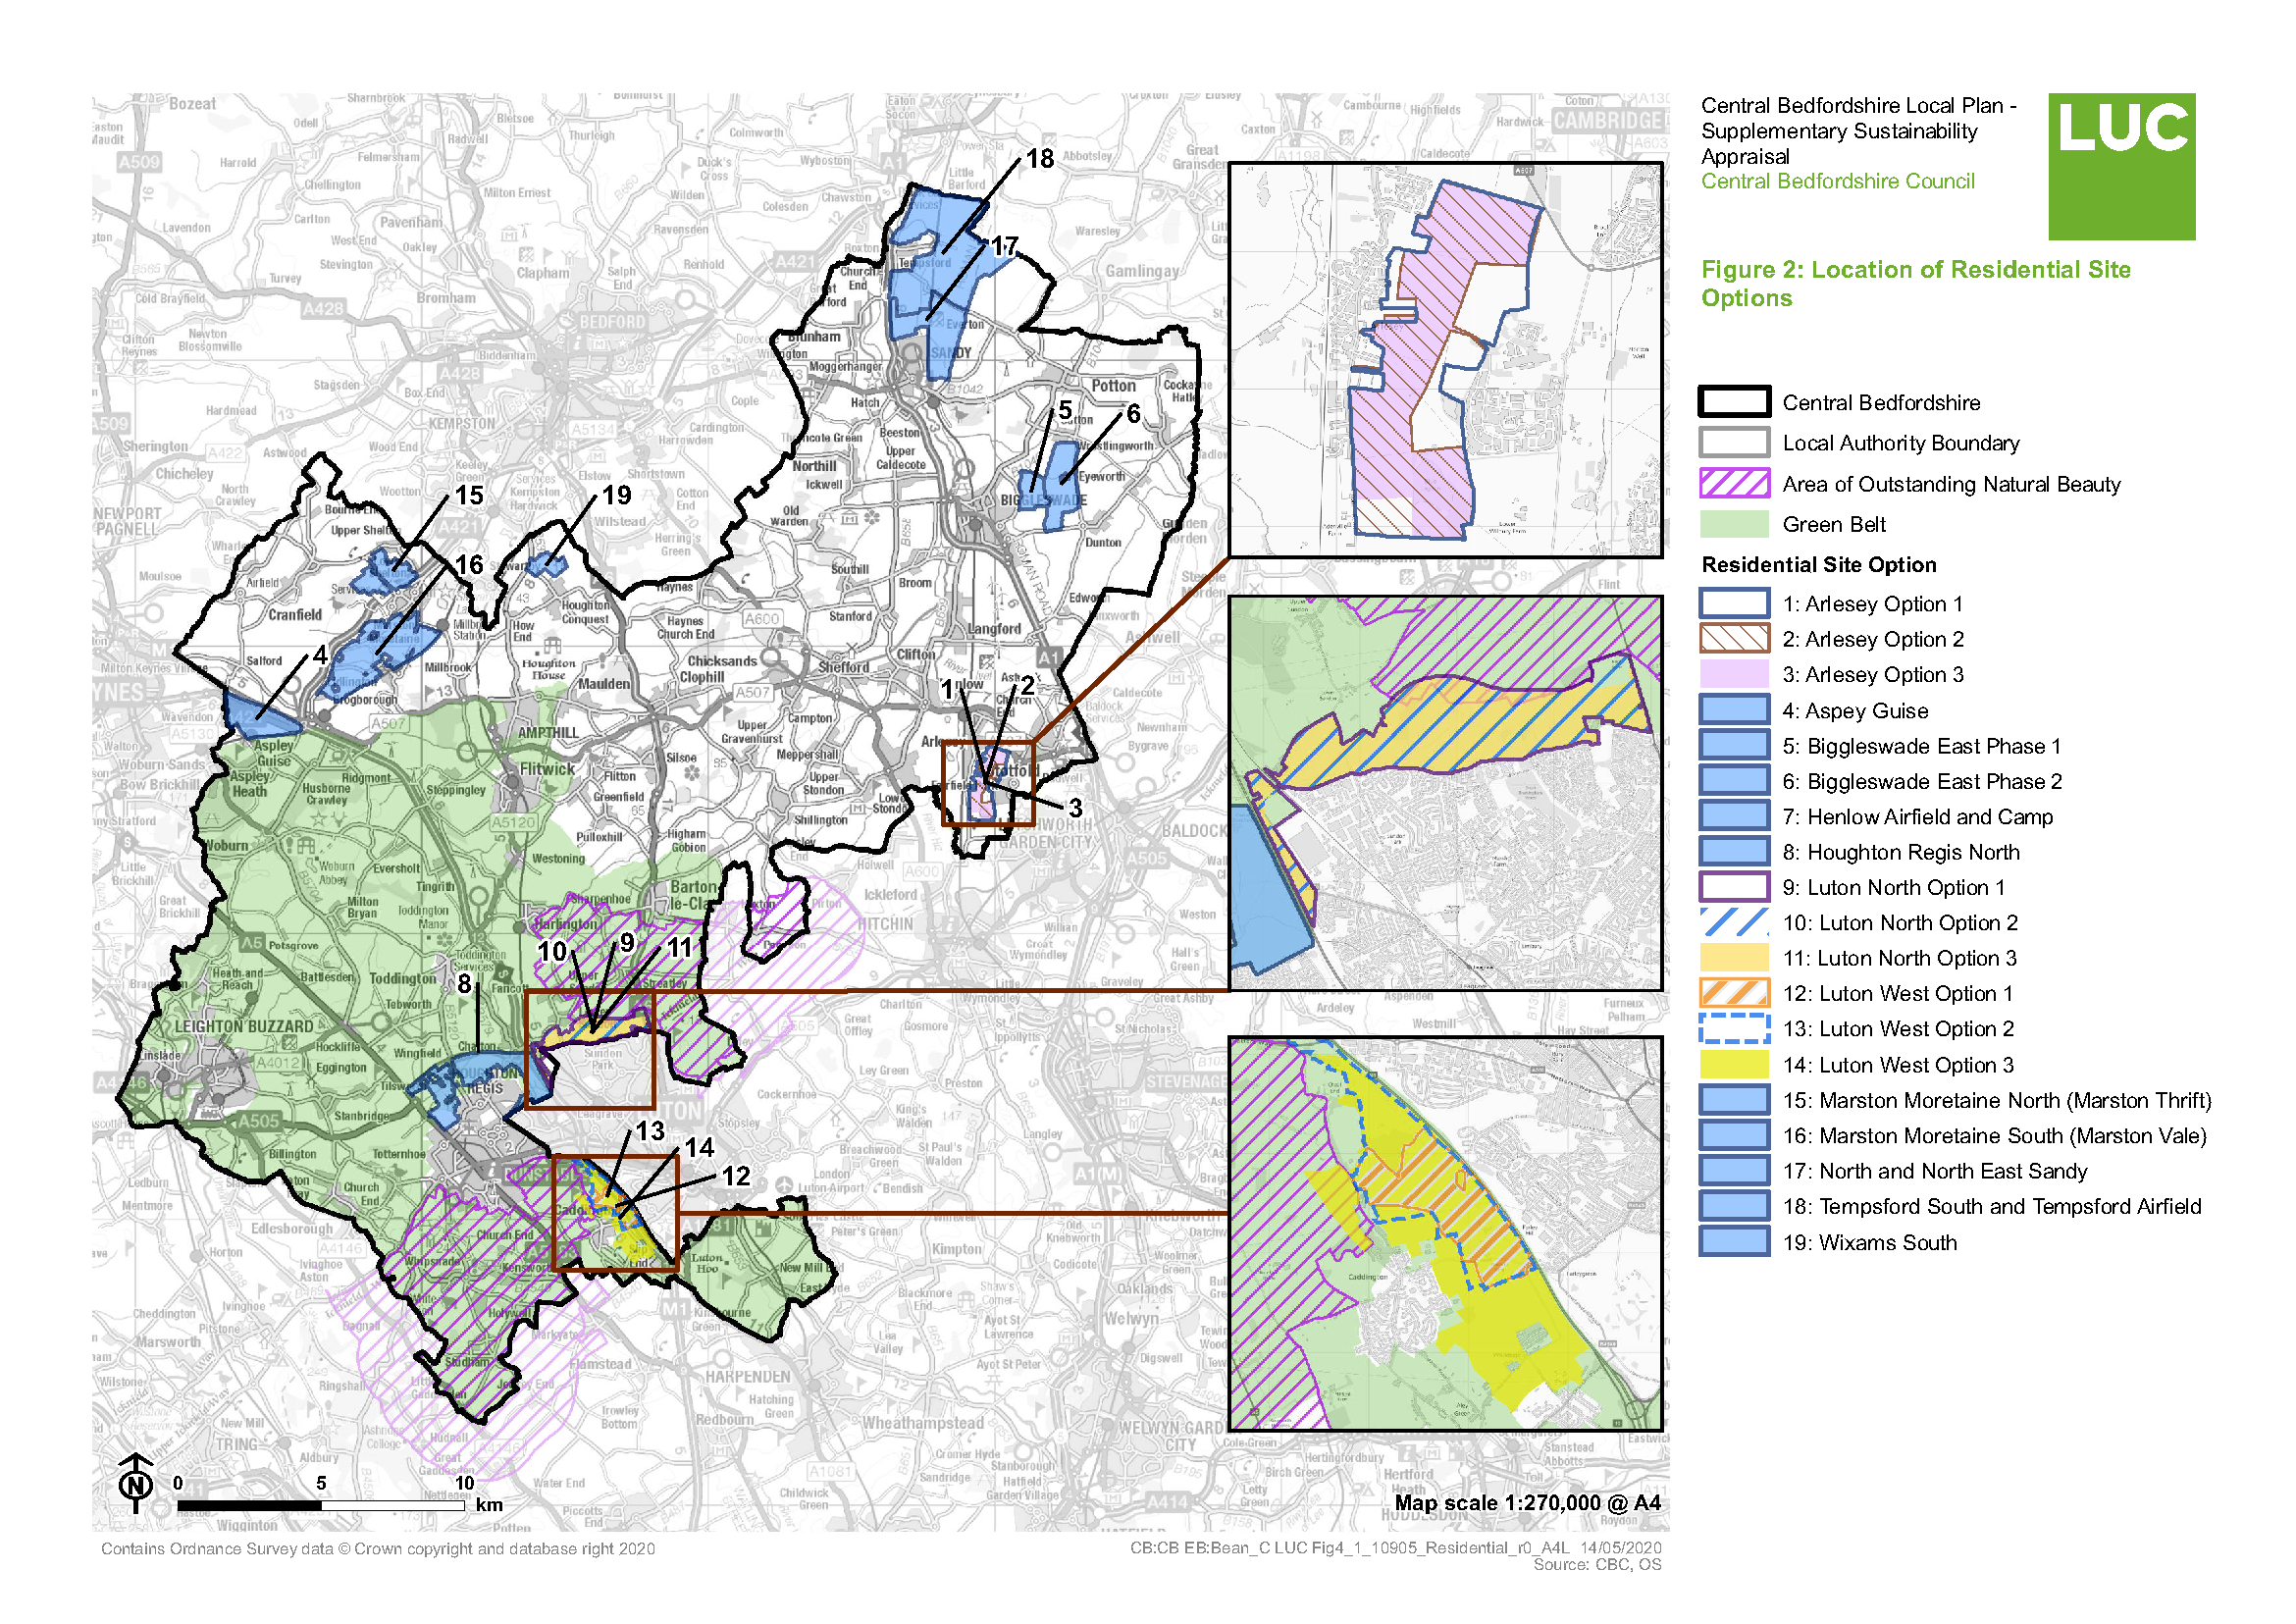
Figure 3
LUC
May 2020
[1] This relates to the provision of services and facilities, both existing, and what could potentially be provided as part of new development. Consistent with the settlement audit this includes community facilities (Place of worship, public library, village hall/community centre/social club), health facilities (GP/ Health centre (Primary Health Care), Dentist, Pharmacy), educational facilities (pre-school/nursery, lower school, middle school, upper school, Colleges/Academies, Universities)), financial (bank/building society), groceries (superstore, convenience store, newsagents), other retail (petrol station/garage, post office) and hospitality (restaurant/café/takeaway, public house with and without food).
[2] Functional Economic Market Assessment and Employment Land Review (Examination Document C08)
[3] Technically this site falls below the size threshold for a standalone settlement. The site is unique, being a brownfield military site that is earmarked for closure. As such it doesn't fall neatly within any of the categories but is closest to categories 1 and 3.
[4] Authority Monitoring Report 2018/19 https://centralbedfordshire.app.box.com/s/nbfeb5eqh497ptwmm6v0acyt13uutcxq/file/620052086092


